Abstract
This study presents an integrated methodology to enhance voltage stability and operational security in the North West Ethiopian power grid by addressing system vulnerabilities and optimizing load-shedding strategies. A hybrid simulation-optimization framework is developed, combining DIgSILENT PowerFactory-based contingency analysis with Particle Swarm Optimization (PSO)-driven intelligent load shedding in MATLAB. The modeled power network comprises 2 generators, 15 buses, 15 transmission lines, and 3 external grids. Vulnerability assessment is conducted using Voltage and Overload Performance Indices (PIV and PIP) to rank critical elements under various contingencies. The analysis identifies the BDII-230 to GOII transmission line as the most vulnerable, where its outage causes voltage drops to 0.908 p.u. at Gondar and 0.923 p.u. at Metema, both falling below acceptable operational limits. Under increased load conditions (50% and 75% load factor), the Gondar bus experiences severe voltage deterioration, dropping to 0.8879 p.u., which significantly stresses system stability. Through PSO-based load shedding, the voltage at Gondar is restored to 0.9538 p.u., demonstrating a 7.4% improvement, while excessive real power (e.g., at BDII230) is reduced from 1.3235 to 0.8958 p.u. under 50% load increase, effectively stabilizing the system. The proposed PSO framework outperforms conventional load-shedding mechanisms by factoring in bus sensitivity and minimizing overall power shed while maximizing voltage recovery. The results provide actionable insights for grid operators and planners, establishing a reliable and scalable method for real-time contingency response in developing power networks.
|
Published in
|
American Journal of Modern Energy (Volume 11, Issue 3)
|
|
DOI
|
10.11648/j.ajme.20251103.11
|
|
Page(s)
|
41-58 |
|
Creative Commons
|

This is an Open Access article, distributed under the terms of the Creative Commons Attribution 4.0 International License (http://creativecommons.org/licenses/by/4.0/), which permits unrestricted use, distribution and reproduction in any medium or format, provided the original work is properly cited.
|
|
Copyright
|
Copyright © The Author(s), 2025. Published by Science Publishing Group
|
Keywords
Contingency Analysis, DIgSILENT PowerFactory, Load Shedding, MATLAB Simulation, Particle Swarm Optimization, Power System Security, Voltage Stability, Vulnerability Assessment
1. Introduction
Electrical energy remains a cornerstone of modern civilization, underpinning virtually every aspect of daily life—from residential and industrial applications to communication systems and entertainment technologies. Its inherent versatility and ease of utilization have made it indispensable across sectors. Although the ideal scenario involves situating power plants close to end-users, practical constraints such as resource availability and environmental considerations often necessitate remote generation sites. To overcome this spatial disparity, high-voltage transmission lines play a critical role by transporting electricity over long distances to local distribution networks, which in turn deliver power to consumers
| [1] | D. B. Aeggegn, A. Salau, and Y. Gebru, “Load flow and contingency analysis for transmission line outage,” Int. J. Electr. Eng., vol. 3, no. September, pp. 581-594, 2020. |
| [2] | M. A. Tikuneh and G. B. Worku, “Identification of system vulnerabilities in the Ethiopian electric power system,” Glob. Energy Interconnect., vol. 1, no. 3, pp. 358-365, 2018, Available: https://doi.org/10.14171/j.2096-5117.gei.2018.03.007 |
[1, 2]
.
Power systems are vulnerable to disruptions, so perform steady-state contingency analysis to identify potential weaknesses. Proactively strengthening the grid's structure and planning for contingencies, can enhance the continuity and stability of power supply
| [1] | D. B. Aeggegn, A. Salau, and Y. Gebru, “Load flow and contingency analysis for transmission line outage,” Int. J. Electr. Eng., vol. 3, no. September, pp. 581-594, 2020. |
[1]
. Power systems can be disturbed by various factors, including equipment failures, communication breakdowns, human error, and severe weather
. They are the problem of the security analysis applications in a power system and understanding these factors helps power system operators and engineers devise strategies to enhance reliability and minimize disruptions. The purpose of ranking vulnerability value in the power system is to the identification of risk level of a power system in case of an unforeseen catastrophic contingency
| [3] | S. A. AHMAD, “Contingency analysis and reliability evaluation of bangladesh power system,” no. April, 2011. |
[3]
.
This research is motivated by the need to enhance the resilience of power systems against unforeseen contingencies. The primary objective is to develop a robust framework for assessing system vulnerability and implementing effective load shedding strategies to mitigate the impact of disturbances.
This paper has made main contributions to this research:
1) To analyze the effect of the severe power and network outage events on the system.
2) To study performance index calculation for ranking of system vulnerability.
3) Analyze power outage scenarios and assess their impact on grid stability, particularly voltage level.
4) Develop a system that utilizes a PSO-based load-shedding strategy to achieve optimal response to contingency events.
Authors in
| [4] | I. B. S, A. Nurdiansyah, A. Lomi, A. E. Power, and S. Stability, “Impact of Load Shedding on Frequency and Voltage System,” IEEE, pp. 110-115, 2017. |
[4]
discussed the impact of load shedding on frequency and voltage systems. One of the factors that influence system stability is frequency and voltage stability. So, frequency and voltage stability need to be considered during electrical power planning and operation to avoid system oscillation that leads to partial or full blackouts. Load shedding needs to be done to restore the system to normal condition after system disturbance. However, its limitation is not considering how many loads should be shed on each bus during an outage of the system.
Mogaka
et al. | [5] | O. Mogaka, R. Orenge, and J. Ndirangu, “Static Voltage Stability Assessment of the Kenyan Power Network,” J. Electr. Comput. Eng., vol. 2021, 2021. |
[5]
proposed a method for static voltage stability analysis of the Kenyan Power Network, which has seen growing demand exceeding generation capacity. The method combines V-Q modal analysis, sensitivity analysis, and power voltage curves to identify vulnerable areas and weak buses. It also uses reactive power loss sensitivity to pinpoint critical lines and assess the impact of tripping one such line.
Kumar et al.
| [6] | R. Kumar, A. Mittal, N. Sharma, I. V. Duggal, and A. Kumar, “PV and QV curve analysis using series and shunt compensation,” PIICON 2020 - 9th IEEE Power India Int. Conf., 2020. |
[6]
analyzed voltage stability in 5-bus and IEEE 9-bus systems using PV and QV curves. These curves reveal system loading and stability. The study explores how series, shunt, and combined compensation methods improve voltage and power flow using Power World simulations.
Sahu et al., 2020
| [7] | P. C. Sahu, R. C. Prusty, and B. K. Sahoo, “Modified sine cosine algorithm-based fuzzy-aided PID controller for automatic generation control of multiarea power systems,” Soft Comput., vol. 24, no. 17, pp. 12919-12936, 2020, Available: https://doi.org/10.1007/s00500-020-04716-y |
[7]
This research proposed an M-SCA-tuned fuzzy-aided PID controller for AGC in multi-area power systems. Using a three-area nine-unit system, dynamic responses are analyzed. M-SCA, an enhanced SCA, optimizes the controller's gains, demonstrating improved convergence over SCA, GA, and PSO. The proposed controller outperforms conventional I, PI, and PID controllers. Validation is performed on a five-area ten-unit system with nonlinear constraints (generation rate constraint, governor dead band, boiler dynamics, time delay) and subjected to sensitivity analysis.
Manjul & Rawat
| [8] | N. Manjul and M. S. Rawat, “PV/QV Curve based Optimal Placement of Static Var System in Power Network using DigSilent Power Factory,” 8th IEEE Power India Int. Conf. PIICON 2018, no. July 2020, pp. 1-6, 2018. |
[8]
investigated the optimal placement of Static Var Compensators (SVCs) to improve power system voltage stability. Due to recent blackouts, voltage stability is crucial. The study uses static voltage assessment techniques and PV/QV curves to identify optimal SVC locations. Simulations were done in DigSilent Power Factory (2018).
Li et al.
| [9] | C. Li, Y. Sun, and Y. Yu, “An Under-frequency Load Shedding Scheme with Continuous Load Control Proportional to Frequency Deviation,” IOP Conf. Ser. Mater. Sci. Eng., vol. 199, no. 1, pp. 0-6, 2017. |
[9]
proposed a new UFLS scheme that sheds loads continuously using power electronics technology. Existing schemes shed loads discontinuously, leading to under-shedding and over-shedding issues. The proposed method continuously adjusts the shedding amount based on the frequency deviation during a transient event. The effectiveness of the scheme is analyzed using a system frequency response model and compared to conventional UFLS schemes.
Pourghasem & Seyedi
| [10] | P. Pourghasem and H. Seyedi, “An under-voltage load shedding scheme to prevent voltage collapse in a microgrid,” Int. Conf. Prot. Autom. Power Syst. IPAPS 2019, no. February, pp. 12-16, 2019. |
[10]
proposed an Under-Voltage Load Shedding (UVLS) scheme to prevent voltage collapse in microgrids. This method disconnects non-critical loads based on a voltage stability index, helping to maintain microgrid stability during island mode operation. The effectiveness of the scheme is tested using simulation software.
Authors in
| [11] | P. S. Engineering, “Contingency Analaysis of Ethiopian Power System on 230 kV and 400 kV Transmission Lines,” 2020. |
[11]
proposed a contingency analysis of the NWREEP network. A power system that is operating under normal mode may face contingencies such as sudden network outages and sudden increases in power demand. Contingency selection is done by calculating performance indexes in the Dig SILENT Power Factory simulation software environment.
Despite extensive research on voltage stability, load shedding, and contingency analysis, several challenges persist in ensuring the resilience of regional power systems like that of North West Ethiopia. Existing methods often fail to dynamically integrate grid vulnerability assessment with intelligent and adaptive load-shedding schemes. Many conventional approaches rely on static or non-optimized mechanisms, lacking sensitivity-based prioritization of critical buses during contingencies. Moreover, limited attention has been given to combining performance index-based vulnerability ranking with real-time optimization algorithms to guide load curtailment in stressed networks. Given the increasing load demands, transformer overloading, and voltage violations identified in prior studies, there is a clear need for a comprehensive framework that not only identifies system weaknesses under various scenarios but also mitigates them through intelligent control strategies. This study addresses these limitations by developing an integrated framework that employs DIgSILENT-based contingency simulation and Particle Swarm Optimization (PSO) for adaptive load shedding, tailored to the specific topology and operational characteristics of the North West Ethiopian power grid.
This study contributes a comprehensive and technically robust framework aimed at enhancing voltage stability and contingency preparedness in the North West Ethiopian power grid. Leveraging a region-specific network modeled in DIgSILENT PowerFactory—comprising 15 buses, 2 generators, 15 lines, and 3 external grids—the research begins with a detailed vulnerability assessment using voltage and overload performance indices (PIV and PIP) to rank critical system elements. This analysis identifies the BDII230-GOII transmission line, along with the Gondar and Metema load buses, as highly susceptible to voltage violations under both normal and stressed conditions. Building on this, a novel Particle Swarm Optimization (PSO)-based load-shedding algorithm is proposed, which dynamically allocates load reductions based on bus voltage sensitivity, enabling targeted and efficient control responses. The methodology is validated through multiple simulated scenarios, including generator outages, line faults, and increased loading conditions (50% and 75%), which highlight severe system instability—such as Gondar’s voltage dropping to 0.8879 p.u. and real power surging at BDII230 to 1.3235 p.u. The PSO-based approach successfully restores voltage at Gondar to 0.9538 p.u. and reduces BDII230’s real power to 0.8958 p.u., thereby mitigating the adverse impacts of contingencies. Furthermore, the study formulates a multi-objective optimization strategy that simultaneously minimizes the amount of power shed and maximizes voltage recovery, offering a scalable and intelligent solution for real-time operational stability in developing power systems.
2. Power Flow Analysis
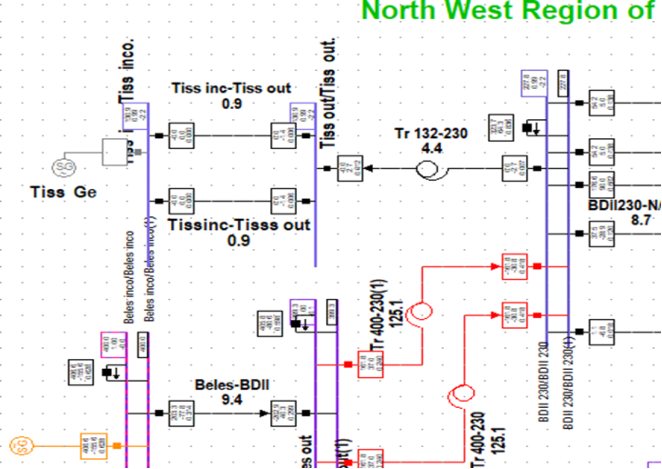
2.1. Single Line Diagram
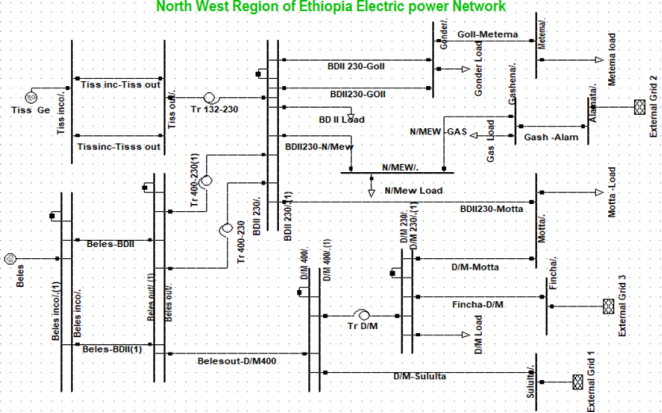
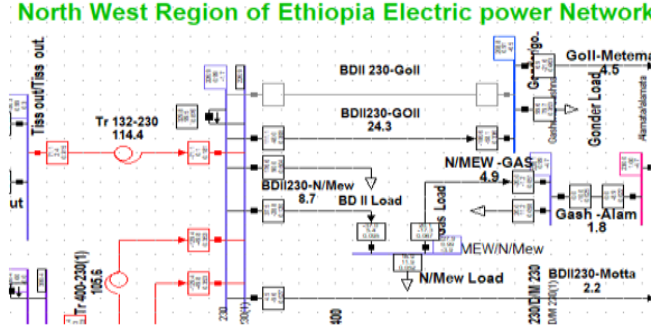
DigSilent Power Factory software was used to model the North West Region's transmission system, including generators, buses, transmission lines, and external grids. This facilitated simulations to analyze the power flow and potential outages of
Figure 1.
Figure 1. Single line diagram of North West Region of Ethiopia Electric Power.
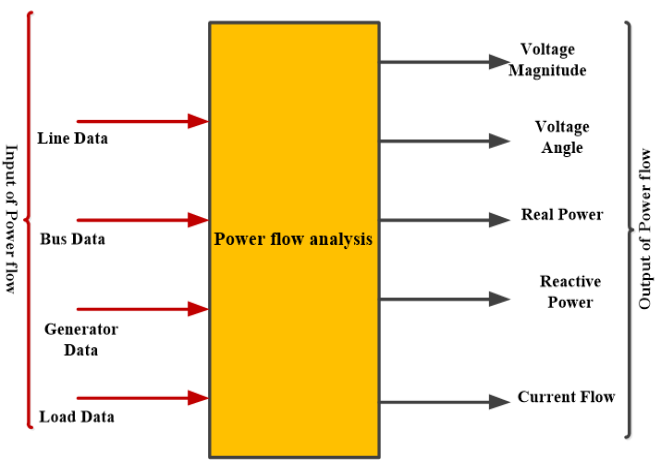
2.2. Mathematical Modeling of Power Flow Analysis
Power flow analysis, crucial for network calculations, requires complete system data. This study utilizes the Newton-Raphson method due to its faster convergence, making it ideal for large power systems
| [12] | C. Ibeni, “Analysis for Electical Load Flow Studies in Port Harcourt, Nigeria, Using Newton Raphson Fast Decoupled Techniques. American Journal of Engineering Research (AJER),” no. 12, pp. 230-240, 2017. |
| [13] | T. Gonen, “- Power Flow Analysis,” Mod. Power Syst. Anal., vol. 2, pp. 490-551, 2013. |
[12, 13]
. The power flow analysis parameters are shown in
Figure 2.
Figure 2. Power flow analysis.
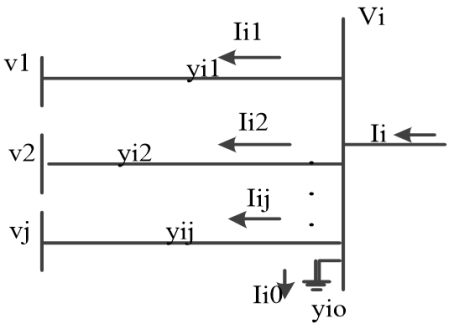
Figure 3 indicates that net power was injected. The nodal network equation formed, shown in the equation for a network with 𝑛 buses, describes the relationship between system voltages V and points of current injection I.
Figure 3. Net Power injected.
Ohm's law states that:
(2)
(3)
The sum of the admittances linked to bus I equals the values of the diagonal elements (Yii). The negative of the admission between busses I and J is equal to the off-diagonal elements (Yij). It is important to remember that the Y-bus is a sparse matrix in large systems.
The bus voltage (Vi), surrounding bus voltages (Vj), and admittances between the bus and its neighboring buses (yij) can all be used to determine the net injected power at any bus, as demonstrated in
Figure 3.
(4)
The power equation at any bus can be written as follows:
(5)
(6)
3. Power System Security and Contingency Analysis
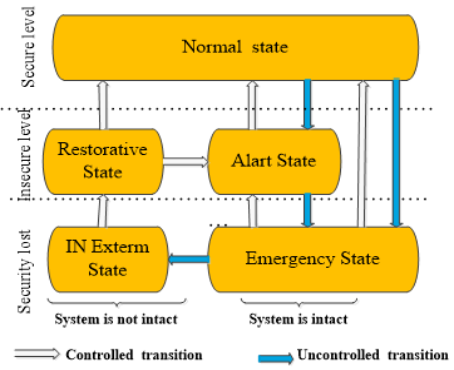
3.1. Security-Related Functions
Figure 4. Power system operating state.
Security assessment in power systems relies on specific metrics
| [14] | A. N. J. B. P. Kundur, Power system stability and control, vol. 7. 1994. |
[14]
. As shown in
Figure 4, the operating state transitions from the actual, real-time data at the top to various potential scenarios is presented and
Table 1 shows the alarm and security limit of the system.
Table 1. Alarm and security limits.
Parameters | Limit of alarm | Limit of security |
Lower bus voltage (P.u.) | 0.950 | 0.900 |
Upper bus voltage (P.u.) | 1.050 | 1.100 |
3.2. Necessary Step for Ranking of System Vulnerability
The technique used to quantify the severity and rank such scenarios according to their severity is called the performance index (PI)
| [15] | N. S. Swaroop, “Contingency Analysis and Ranking on 400 Kv Karnataka Network By Using Mipower,” Ijsdr, vol. 1, no. 10, pp. 287-294, 2019. |
| [16] | M. S. Geremew, Y. G. Workie, and L. B. Techane, “Identification of System Exposure for the Northwest Region of Ethiopian Electric Power,” Iran. J. Sci. Technol. - Trans. Electr. Eng., vol. 0123456789, 2024, Available: https://doi.org/10.1007/s40998-024-00698-x |
[15, 16]
.
Define the comprehensive Performance Index (PI) sets as follows for a system with n busses and l lines:
3.2.1. Voltage Performance Index
Calculating the voltage performance index (PIV) is done as
(7)
where: -nb: The quantity of buses, Vnew: magnitude of the post-outage voltage at bus I, Vnom: is the mean of the voltages at bus I (1.0 p.u.) Vmax & Vmin., The maximum and minimum voltage limit are denoted by Vimax and Vimin, respectively.
3.2.2. Index of Overload Performance
The PIP, or overload performance index, is assessed as
(8)
where, , nl: total quantity of series equipment, Pilnew: new real power flow in the line, Pilmax: maximum power flow in line that is active, Vi: the voltage at the bus that I measured using the NRLF solution, Vj: the voltage at bus j as determined by the NRLF solution, x reactance of the line that joins Buses "i" and "j."
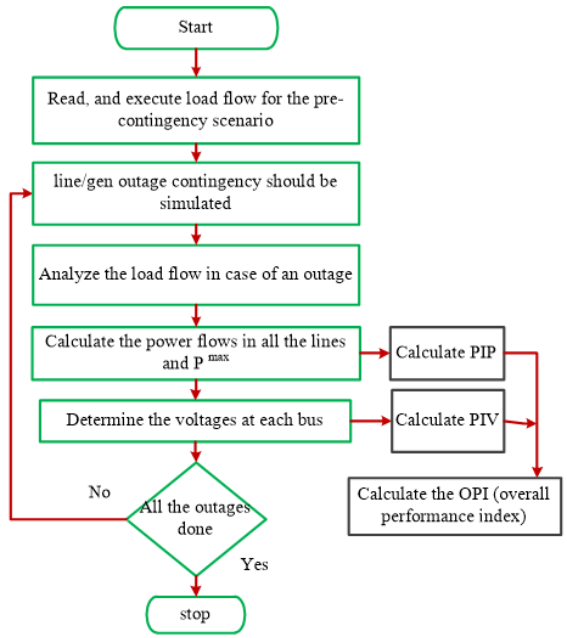
3.2.3. Algorithm for Ranking System Vulnerability
The algorithm for ranking the system vulnerabilities is shown in
Figure 5.
Figure 5. Algorithm for ranking the system vulnerability.
3.3. Load Shedding System
Load shedding is a technique that automatically reduces power consumption in specific areas to prevent system instability caused by factors like surges in demand, transmission line failures, or generator outages
| [17] | S. Gupta, “A Review : Power System Stability Improvement using Power System Load Shedding Scheme,” vol. 3, no. 4, pp. 253-256, 2016. |
[17]
. System phase angle instability as well as a drop in frequency and voltage will result from this instability.
3.3.1. Computational Intelligent Load Shedding
Numerous researchers have devised several techniques for load shedding and restoration, including computational, adaptive, and convectional systems.
Due to the significant variations in generating capacity, the flexible distribution network, the high-frequency decay rate, and the limited number of loads, these technologies are not suitable for industrial plants
| [18] | P. Lakra and M. Kirar, “Load Shedding techniques For System With Cogeneration,” no. February, 2018. |
[18]
. Pre- and post-disturbance operating circumstances, the type, length, and system transient response to a disturbance are all included in an intelligent load-shedding scheme
| [19] | H. Haes, M. Esmail, H. Golshan, T. Cuthbert, and N. D. Hatziargyriou, “An Overview of UFLS in Conventional, Modern, and Future Smart Power Systems : Challenges and Opportunities,” Electr. Power Syst. Res., vol. 179, no. February 2019, p. 106054, 2020, https://doi.org/10.1016/j.epsr.2019.106054 |
[19]
.
3.3.2. Under Voltage Load Shedding
In the event that the system experiences low voltage, undervoltage load shedding is implemented to make operations easier.
| [20] | M. Usman, A. Amin, M. M. Azam, and H. Mokhlis, “Optimal Under Voltage Load Scheme for a Distribution Network Using EPSO Algorithm,” no. September 2019, 2018. |
| [21] | R. M. Larik, M. W. Mustafa, S. Qazi, and N. H. Mirjat, “Under Voltage Load Shedding Scheme to Provide Voltage Stability,” Energy, Environ. Sustain. Dev. 2016 (EESD 2016), no. November, 2016. |
[20, 21]
. Therefore, the voltage may begin to fall below tolerance limits during a disturbance. Estimating the overall power difference between the before and after conditions is the algorithm's initial phase. The location and amount of load to be shed from the load bus must be selected after the disturbance's magnitude has been established. The amount of load to be shed on each bus is then determined based on the voltage sensitivity of each bus. As a result, the maximum load shed for the bus with voltage sensitivity that is extremely near the instability limit will be determined by the reciprocal of its sensitivity as a fraction of the total reciprocals of all load bus sensitivities. As seen in
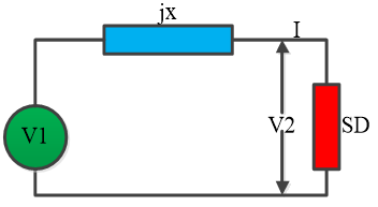
Figure 6, let us assume a two-bus system with a single generator, transmission line, and load in order to demonstrate sensitivity analysis.
Figure 6. Two-bus representation model.
With V1 as the sending end voltage, V2 as the receiving end voltage, and cos 𝜃 as the load power factor, the complex load in this case is assumed to be S12=P12+jQ12. Therefore, we obtain the Eq. from the figure.
The equations will be as follows after further simplification for a two-bus system:
(10)
The power delivered at the receiving end is now PD = -P12 and QD = -Q12. This only applies to two-bus systems; larger systems follow the same process. After establishing the relationship between QD and V2, we may differentiate relationship (
10) to obtain.
The generalized equation for a bus system is,
(11)
Therefore, the relationship 𝑑𝑄/𝑑𝑉 for each bus can be expressed as follows:
(12)
We used the reciprocal of the voltage sensitivity as a fraction of the total of all the reciprocals of voltage sensitivities in order to determine this load number
. The reciprocal is taken into consideration because it will be smaller and so shed less weight at a higher slope (i.e., a more stable scenario). Consequently, it may be claimed that,
(13)
A fractional value of each bus's voltage sensitivity is provided by the equation above. The amount of load to be shed and the 𝑑𝑉/𝑑𝑄 value at each bus are now directly correlated.
The sum of the values of all the buses now equals.
(14)
The sum of the 𝑑𝑉/𝑑𝑄 values at each load bus is provided by equation (
14). Each bus's load shed is a portion of the overall load that must be shed in order to preserve power balance. In relation to the total computed above, this fraction of load at each bus is proportional to the fraction of the 𝑑𝑉/𝑑𝑄 value at each bus. Equation (
15) provides a depiction of the sensitivity index.
(15)
3.4. Particle Swarm Optimization
The following is the presentation of the particle swarm optimization algorithm:
Step 1: - For a power outage, run the entire A. C. Newton-Raphson power flow.
Step 2: - Determine the load bus's sensitivity factor.
Step 3: -Determine the amount of disruption that each bus will experience based on the sensitivity factors that were acquired.
Step 4: - Create a starting population of particles at random.
Step 5: - fitness determines each particle's fitness.
Step 6: - Update each particle’s personal best solution pbest by comparing the current pbest fitness of each particle.
Step 7: - Compute the new position and velocity of particles.
(16)
Step 8: - Evaluate the new fitness value of each particle (with updated position and velocity) and find update the global best solution. and update the Pbest and best values too.
Step 9: - Generate a new population.
Step 10: - Go to step 7 until the convergence criterion is satisfied.
Step 11: - Stop the simulation.
3.4.1. Objective Function
To calculate the objective function,
The equation represents the multi-objective function for power shedding in the load bus and voltage profile change. By minimizing the goal functions, the optimization method establishes the extent of power shedding.
Where, f1 and f2 are the objective functions used to identify power shed for each buses and voltage profile change respectively. The proposed strategy aims to minimize the load shedding value while maximizing the voltage stability of the power system.
The following mathematical formulation of f1, f2 listed in equation (
18) is used to defines the individual objective function, which is important for optimal load shedding and voltage stability when using the PSO algorithm.
where: -𝑆𝑖: Each load bus has shed its load., 𝑉𝑖: The voltage at bus I.
3.4.2. Constraints
Both equality and inequality constraints must be handled in the optimization problem.
1) Equality Constraints:
Eq. (
19) can be used to describe the equality criteria for both the real and reactive power balance equations.
(19)
2) Inequality Constraints:
The ranges of bus voltage magnitudes and the minimum and maximum real and reactive power during generation bus injection serve as inequality limits.
(20)
4. Simulation Result and Analysis
4.1. Simulation Result at Base Case
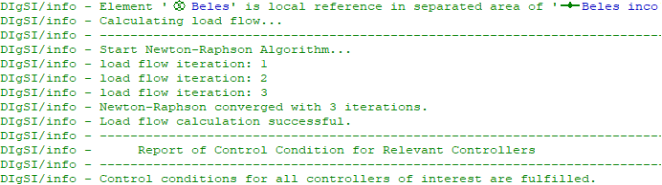
This study analyzes the North West Region power system's vulnerability using DigSilent Power Factory. The starting Newton-Raphson algorithm of the system is as shown in
Figure 7. Simulations consider two conditions:
1) Contingency Analysis: Evaluate and rank system weaknesses by simulating potential outages.
2) Load Optimization: Apply optimization techniques to manage load bus conditions.
Figure 7. Newton-Raphson algorithm of the system.
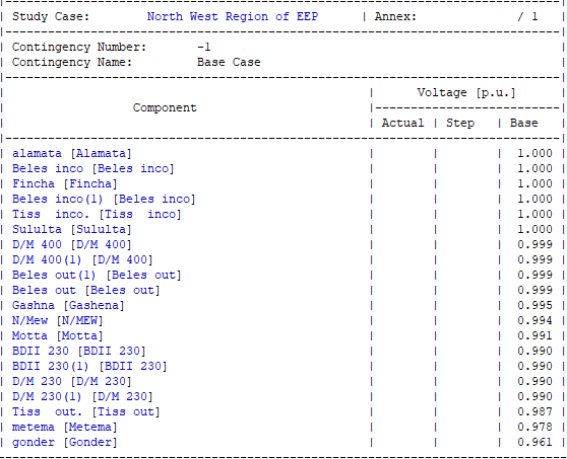
4.1.1. Voltage Violations of Each Bus in the Base Case
Figure 8 shows normal voltage levels across all buses, but some may dip below safe limits during operating state changes (alert to emergency, emergency to extreme). This highlights the importance of contingency analysis to identify and address potential security risks.
Figure 8. Base case voltage violations of each bus.
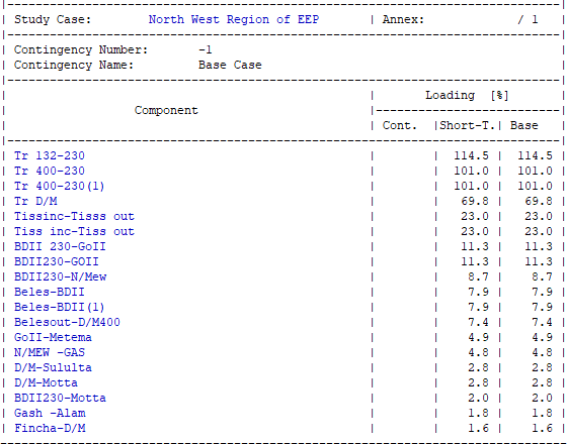
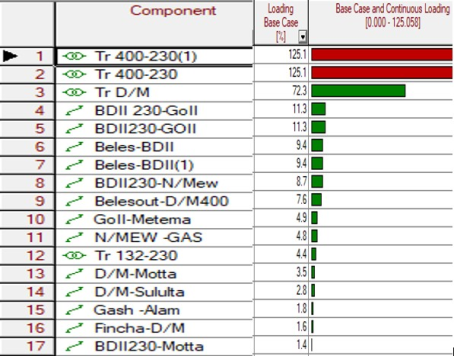
4.1.2. Branch Loading Violation in Base Case
While all other transformers and transmission lines (including Tr D/M, Tissinc-Tissout, and BDII 230-GOII) operate within normal load limits in the base case, transformers Tr 132-230 and Tr 400-230 exhibit slight overloading (exceeding 100% capacity).
Figure 9 presents the loading violations of branches in the base case.
Figure 9. Branch loading violation in Base Case.
4.2. Scenario 1: Simulation Result of Loading Condition at Load Bus
4.2.1. Voltage Violations of Load Bus at Loading Condition
The simulation results demonstrate that increasing load demand leads to voltage violations at various load buses. Specifically, increased load demand can cause voltage levels at certain buses to fall below acceptable limits. As illustrated in
Table 2, the voltage magnitudes at buses BDII230, Metema, and Gondar decrease to 0.95, 0.86, and 0.85 per unit, respectively, after the load increase in gonder load bus. All of these values are below the permissible voltage threshold. Notably, the Gondar load bus experiences a particularly significant voltage drop to 0.93 per unit when subjected to a similar load level as the BDII230 load bus, indicating a critical voltage stability concern.
Table 2. Voltage violations of load bus at loading condition.
Bus name | The state of loading on the load bus |
Base case | BDII230 | Gonde | Metem | Gash | N/Mew | Motta | D/M230 |
BDII 230 | 0.99 | 0.97 | 0.95 | 0.98 | 0.98 | 0.98 | 0.98 | 0.98 |
D/M 230 | 0.99 | 0.98 | 0.98 | 0.99 | 0.99 | 0.99 | 0.98 | 0.95 |
Gashen | 0.99 | 0.97 | 0.96 | 0.993 | 0.92 | 0.96 | 0.99 | 0.99 |
Gonder | 0.96 | 0.93 | 0.85 | 0.949 | 0.96 | 0.96 | 0.96 | 0.96 |
Metema | 0.98 | 0.95 | 0.86 | 0.934 | 0.97 | 0.98 | 0.97 | 0.97 |
Motta | 0.99 | 0.97 | 0.96 | 0.99 | 0.98 | 0.98 | 0.97 | 0.97 |
N/Mew | 0.99 | 0.96 | 0.95 | 0.99 | 0.95 | 0.95 | 0.99 | 0.99 |
4.2.2. Loading Violations of Branch at the Loading Condition
An increase in load demand on the base case network leads to the overloading of certain transformers. As shown in
Table 3 transformers Tr-400-230 and Tr-132-230 experience significant overloading with load percentages reaching 279% and 137%, respectively, when the load on the BDII-230 bus increases. This indicates violations of load limits on these branches. Notably, even without any line or generator outages, transformer Tr-400-230 exhibits a critical overload exceeding 279%.
Table 3. Loading violations of branch at the loading condition.
Loading parameter | The state of loading on the load bus |
Base case | BD230 | Gonder | Metema | Gash | N/Mew | Motta | D/M 230 |
Tr132-230 | 114.5 | 137 | 160 | 114 | 114 | 114 | 114 | 114 |
Tr400-230 | 101 | 279 | 252 | 109 | 123 | 119 | 110 | 113 |
Tr D/M | 69.8 | 93 | 91 | 71 | 72.7 | 72.3 | 83.1 | 231 |
Beleout-D/M400 | 7.4 | 7.7 | 7.3 | 7.4 | 7.4 | 7.4 | 7.3 | 10.9 |
BD230-GOII | 11.3 | 11.7 | 55.1 | 13.6 | 11.4 | 11.4 | 11.3 | 11.4 |
BD230-N/Mew | 8.7 | 8.8 | 8.9 | 8.7 | 17.5 | 15.8 | 8.7 | 8.7 |
BDII230-Motta | 2 | 5.5 | 5.6 | 2.0 | 2 | 2.0 | 6.6 | 8.4 |
Belesin-Beleout | 7.9 | 17.2 | 14.8 | 8.1 | 8.7 | 8.6 | 8.4 | 11.1 |
D/M-Motta | 2.8 | 7.9 | 7.4 | 2.8 | 3.1 | 3.0 | 5.5 | 7.3 |
GOII-Metema | 4.9 | 4.7 | 3.5 | 5.7 | 4.8 | 4.8 | 4.9 | 4.8 |
N/Mew-Gas | 4.8 | 5.0 | 5.1 | 4.8 | 14.7 | 5.2 | 4.8 | 4.9 |
Tissin-Tissout | 23 | 27.4 | 31.9 | 22.9 | 22.9 | 22.9 | 22.9 | 22.8 |
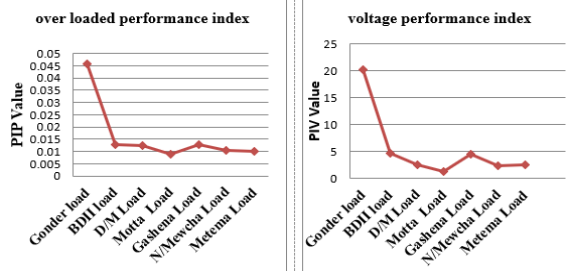
4.2.3. Network Performance Indices for Loading Scenario
Figure 10 depicts performance indices for active power and voltage under various load bus loading conditions, respectively.
Table 4 correspondingly ranks system vulnerability based on the overall performance index. Because of their higher performance indices than the rest, it determines that Gondar, BDII230, and Gashena are the network's most vulnerable load buses.
Figure 10. PIP and PIV value of line & bus Respectively.
Table 4. Rank and overall performance index under loading conditions.
l | Event of contingency | Index of Performance | Rank |
PIP for the line | PIV for the bus |
1 | Gondar load | 0.0456 | 20.1896 | 1 |
2 | BDII load | 0.0128 | 4.6764 | 2 |
3 | D/M Load | 0.0124 | 2.5648 | 5 |
4 | Motta Load | 0.0088 | 1.2736 | 7 |
5 | Gashena Load | 0.0127 | 4.4736 | 3 |
6 | N/Mewcha Load | 0.0105 | 2.3168 | 6 |
7 | Metema Load | 0.0101 | 2.5916 | 4 |
4.3. Scenario 2: Simulation Result at Generator Outage Condition
This scenario simulates the impact of the power outage at the Tiss Ge generating plant on the overall power system. By modeling this extreme condition, we can assess the system's resilience and identify potential vulnerabilities.
Figure 11 provides a comprehensive overview of the system under these outage conditions. The simulation results will reveal how the loss of Tiss Ge’s generation capacity affects various aspects of the system, including voltage stability, line loading, and contingency analysis, which examines the system's ability to withstand further disturbances or outages following the initial Tiss Ge.
Figure 11. Tiss Ge Generator Outage.
4.3.1. Loading Violations of Branches During Generator Outage
Contingency analysis reveals the overloading of lines and transformers upon outages. For instance, when the Tissa Ge Generator Station is offline, Tr400-230 and Tr D/M transformers experience increased loading percentages (101 to 125% and 69.8 to 72.2%, respectively) compared to the base case, with no outgoing line changes. Branches' loading violations during the generator outage are depicted in
Figure 12.
Figure 12. Loading violations of branches during generator outage.
4.3.2. Load Bus Voltage Violations During a Generator Outage
This network includes two generation stations: Beles Ge and Tis Ge. As shown in
Table 5, the impact of an outage at each station is markedly different. An outage at the Tis Ge generation plant does not adversely affect the system; no voltage violations occur because the remaining generation capacity is sufficient to meet the load demand. However, an outage at the Beles Ge generation plant results in system divergence, indicating that the remaining generation is insufficient to satisfy the demand. This implies that if the Beles Ge generation plant is taken offline, the network will experience a blackout.
Table 5. Load bus voltage violations during a generator outage.
Name of the load bus | Generator outage scenarios |
Base case | Tiss Ge | Beles Ge |
BDII 230 | 0.990 | 0.990 | Cannot be converged |
D/M 230 | 0.990 | 0.990 |
Gashena | 0.995 | 0.995 |
Gonder | 0.961 | 0.961 |
Metema | 0.978 | 0.978 |
Motta | 0.991 | 0.991 |
N/Mew | 0.994 | 0.994 |
4.4. Scenario 3: Simulation Result at Line Outage Condition
4.4.1. BDII230 - GOII Line Outage
This scenario presents the simulation results of a line outage condition in the system.
Figure 13 illustrates the transmission network of the system, highlighting the potential impact of a line outage on the surrounding area. By analyzing the simulation results, we can gain insights into several key areas. These include power flow disruptions, which detail how the line outage affects the flow of power within the system; voltage drops, which indicate possible drops in voltage levels at different network locations as a result of the line outage's disruption of power flow; overloading of lines and transformers, which indicates the possibility of overloading the remaining infrastructure as it tries to carry the load that the line outage previously served.
Figure 13. BDII230-GOII line outage.
4.4.2. Load Bus Voltage Violations During a Line Outage
This simulation demonstrates how voltage violations at each bus indicate potential voltage level decreases at various points in the network due to power flow disruption caused by a line outage. Specifically, the simulation models an outage of the BDII230-GOII line. Consequently, the Gondar and Metema load buses are most significantly affected, exhibiting voltage profiles of 0.908 and 0.923 per unit, respectively, both of which fall below the acceptable limit. Additionally, when the Tr D/M transformer is not in use, the voltage profile of D/M 230 also falls below the permissible limit. The overall effects of each line outage are compiled in
Table 6.
Table 6. load bus voltage violations during a line outage.
Bus name | scenarios of line and transformer outages |
Base case | Belesout-D/M 400 | BDII230-GOII | Belsinc-Belesout | Tssin-Tissout | Tr132-230 | BD230-Motta | D/M230-Motta | Tr D/M | Tr400-230 |
BDII230 | 0.990 | 0.991 | 0.987 | 0.989 | 0.988 | 0.990 | 0.989 | 0.989 | 0.985 | 0.984 |
D/M 230 | 0.990 | 1.002 | 0.990 | 0.989 | 0.990 | 0.990 | 0.989 | 0.988 | 0.894 | 0.989 |
Gashena | 0.995 | 0.996 | 0.992 | 0.994 | 0.993 | 0.995 | 0.994 | 0.994 | 0.991 | 0.989 |
Gonder | 0.961 | 0.962 | 0.908 | 0.959 | 0.958 | 0.961 | 0.958 | 0.958 | 0.956 | 0.954 |
Metema | 0.978 | 0.979 | 0.923 | 0.976 | 0.975 | 0.978 | 0.977 | 0.977 | 0.972 | 0.971 |
Motta | 0.991 | 0.979 | 0.989 | 0.989 | 0.989 | 0.991 | 0.985 | 0.985 | 0.945 | 0.987 |
N/Mew | 0.994 | 0.995 | 0.991 | 0.993 | 0.992 | 0.994 | 0.994 | 0.994 | 0.990 | 0.988 |
4.4.3. Branch Loading Violations During a Line Outage
The simulation results demonstrate that line and transformer loading violations are a consequence of line outage conditions. In particular, the loading of Tr 400-230, Tr D/M, and the remaining portion of the BD230-GOII line is greatly impacted by the disconnection of the BDII230-GOII line. The loading percentage of these components increased as follows: Tr 400-230 from 101% to 105.6%, Tr D/M from 69.8% to 70.8%, and the remaining BD230-GOII line from 11.3% to 24.3%. These increases highlight the significant impact of the line outage on system loading capacity. The overall loading violations of lines and transformers under each line outage condition are summarized in the accompanying
Table 7.
Table 7. Branch loading violations during a line outage.
Loading parameter | Situations of line and transformer outages |
Base case | Belesout-D/M 400 | BDII230-GOII | Belsinc-Belesout | Tssin-Tissout | Tr132-230 | BD230-Motta | D/M230-Motta | Tr D/M | Tr400-230 |
Tr 132-230 | 114.5 | 114.8 | 114.4 | 114.3 | 120.9 | 0.0 | 114.4 | 114.4 | 114.6 | 115.1 |
Tr 400-230 | 101 | 129.2 | 05.6 | 100.9 | 103 | 125.3 | 99.9 | 104.6 | 135.0 | ---- |
Tr D/M | 69.8 | 51.6 | 70.8 | 69.8 | 70.4 | 72.3 | 74.9 | 68.2 | 0.0 | 80.7 |
Beleout-D/M400 | 7.4 | --- | 7.4 | 7.4 | 7.4 | 7.5 | 7.4 | 6.9 | 8.4 | 7.7 |
BD230- GOII | 11.3 | 11.3 | --- | 11.3 | 11.4 | 11.3 | 11.3 | 11.3 | 11.4 | 11.3 |
BDII230-Motta | 2 | 18.3 | 2.2 | 1.9 | 2.1 | 1.5 | --- | 3.4 | 20.7 | 2.6 |
Belesin-Beleout | 7.9 | 7.4 | 7.7 | --- | 7.8 | 9.4 | 7.8 | 7.8 | 7.9 | 7.9 |
D/M-Motta | 2.8 | 15.6 | 2.6 | 2.8 | 2.6 | 3.5 | 3.4 | --- | 18.7 | 5.1 |
Tissin- Tissout | 23 | 23 | 22.9 | 22.9 | --- | 0.00 | 22.9 | 22.9 | 22.9 | 23.0 |
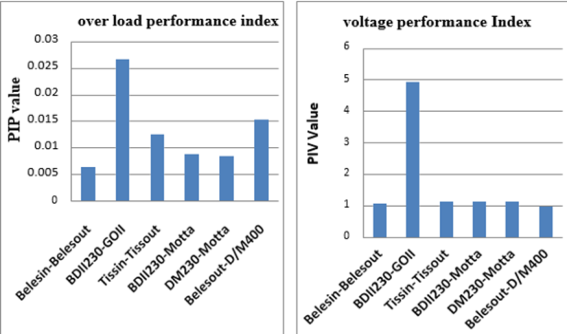
4.4.4. Network Performance Indices for Line Outage
Figure 14 illustrates estimated line outage overload and voltage performance indices.
Table 8 aligns these indices, ranking system vulnerability. The table shows that, with noticeably higher performance indices than the others, BDII230-GOII, Tissin-Tissout, and DM230-Motta are the most vulnerable lines in the North-West EEP region.
Figure 14. Line and bus PIP and PIV values during a line outage, respectively.
Table 8. Rank and overall performance index during a line outage.
No | Contingency events Line outage | Performance index | Rank |
From | To | PIP for line | PIV for bus |
1 | Belesin | Belesout | 0.0064 | 1.082 | 5 |
2 | BDII230 | GOII | 0.0268 | 4.922 | 1 |
3 | Tissinc | Tissout | 0.0125 | 1.142 | 2 |
4 | BDII230 | Motta | 0.0089 | 1.133 | 4 |
5 | DM230 | Motta | 0.0085 | 1.141 | 3 |
6 | Belesout | D/M400 | 0.0154 | 0.981 | 6 |
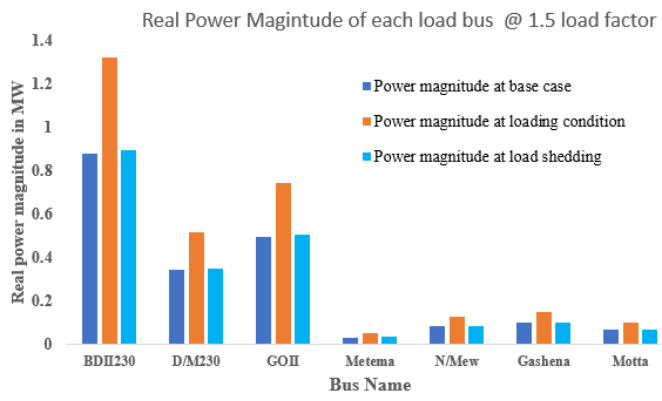
4.5. Scenario 4: Simulation Result of Load Bus Real Power Magnitude During Loading Condition
This paper focuses on load shedding as a solution to variations in load bus demand, which this study identifies as the primary cause of system instability. A load-shedding plan is put in place to determine and cut the necessary amount of electricity from particular load buses in order to solve this problem.
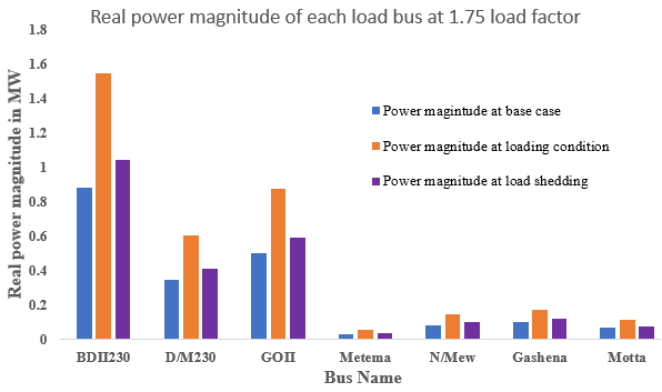
Figure 15 and
Figure 16 illustrate the real power of the load buses under normal conditions, during contingencies (specifically, potential outages leading to increased load demand), and after the application of the load-shedding system. When load demand increases by 50% and 75%, real power also increases, resulting in system disruptions. However, the implemented load shedding effectively reduces real power and maintains system stability. For example, as shown in
Figure 15, the normal real power load of the BDII230 bus is 0.8823 per unit. With a 50% increase in load demand, its real power increased from 0.8823 to 1.3235 per unit. After the load-shedding action was applied, the real power decreased from 1.3235 to 0.8958 per unit. Likewise, there was a commensurate decrease in real power at the remaining load buses.
Figure 15. Real power of load bus in normal, during contingency, and after Shedd at 1.5 load factor.
Figure 16. The real power of the load bus is normal, during contingency, and after Shedd at 1.75. load factor.
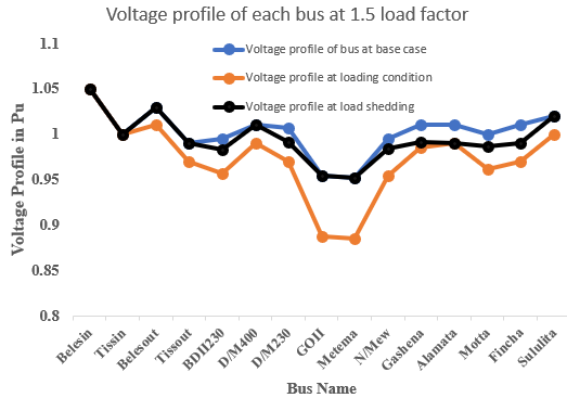
4.6. Scenario 5: Simulation Result of Voltage Profile for Each Bus During Loading Condition
Each bus's system voltage profile is displayed in the simulation results.
Figure 17 summarizes voltage profile of each bus under normal conditions, during contingencies (increased load demand), and after load shedding. As load demand increases by 50%, voltage profiles for most buses dip below normal levels. However, load shedding effectively restores voltage profiles to their normal operating range. For instance, the Gondar load bus voltage drops from 0.954 per unit (normal) to 0.887 per unit (50% increase) but recovers to normal after load shedding.
Figure 17. Bus voltage of 15 bus system in Normal, during contingency, and after load shed load factor.
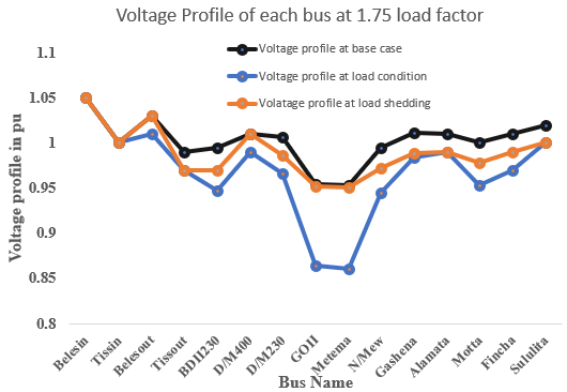
Figure 18 summarizes the voltage profile of each bus under normal conditions, during contingencies (specifically, A 75% rise in the demand for load), and after load shedding. With A 75% rise in the demand for load, the voltage profiles for most buses decrease below normal levels. However, implementing load shedding effectively restores these voltage profiles to within their normal operating range. For example, the voltage at the Gondar load bus drops from 0.954 per unit under normal conditions to 0.887 per unit with the 50% load increase (as previously stated), but it is expected to recover to its normal level after load shedding is applied in the 75% load increase scenario.
Figure 18. Bus voltage of 15 bus system in Normal, during contingency, and after load shed at 1.75 load factor.
5. Conclusion
In this study, a comprehensive approach to improving power system security and voltage stability for the North West Ethiopian power grid was proposed and validated through detailed simulations. The work addressed key operational challenges arising from unexpected outages, increased load demand, and component failures by integrating contingency analysis with intelligent load-shedding mechanisms. The system was modeled in DIgSILENT PowerFactory and analyzed under various scenarios, including base case operation, load increase conditions, generator outages, and line failures. Using performance indices—voltage performance index (PIV) and overload performance index (PIP)—the study successfully identified critical network components, with the BDII230-GOII transmission line and Gondar and Metema buses emerging as the most vulnerable elements. Significant voltage violations and transformer overloading were observed under load growth scenarios, with voltage at the Gondar bus dropping to 0.8879 p.u. and transformer loading exceeding 278%.
To mitigate these effects, a Particle Swarm Optimization (PSO)-based load-shedding strategy was developed, incorporating bus voltage sensitivity to optimally allocate load reductions. The strategy demonstrated effective performance by restoring the Gondar voltage to 0.9538 p.u. and reducing excessive real power loads—for instance, reducing the BDII230 bus from 1.3235 to 0.8958 p.u. The multi-objective optimization minimized the amount of load to be shed while maximizing voltage stability, thereby preventing cascading failures and enhancing system resilience. These results confirm the efficacy of combining simulation-based contingency ranking with intelligent optimization techniques for managing grid stability under dynamic and adverse operating conditions.
Future work should focus on evaluating the scalability of the proposed PSO-based scheme on larger and more complex systems, such as IEEE 39-bus or actual national transmission networks. Additionally, the impact of high penetration of renewable energy sources—characterized by variability and intermittency—should be analyzed to further refine the robustness of the proposed methodology under diverse operating conditions.
Abbreviations
AC | Alternative Current |
GA | Genetic Algorithm |
IEEE | Institute of Electrical and Electronics Engineers |
NWREEP | North West Region of Ethiopia Electric Power |
PID | Proportional Integral Derivative |
PIP | Overload Performance Index |
PIV | Voltage Performance Indices |
PSO | Particle Swarm Optimization |
PV | Active power Vs Voltage |
QV | Reactive Power Vs Voltage |
SVC | Static Var Compensator |
UFLS | Under Frequency Load Shadding |
UVLS | Under Voltage Load Shading |
Author Contributions
Mebratu Sintie Geremew: Conceptualization, Data curation, Formal Analysis, Investigation, Methodology, Resources, Software, Supervision, Visualization, Writing – original draft, Writing – review & editing
Yalew Gebru Werkie: Conceptualization, Data curation, Formal Analysis, Investigation, Methodology, Resources, Software, Supervision, Visualization, Writing – original draft, Writing – review & editing
Lidia Bitew Techane: Formal Analysis, Supervision, Validation, Visualization, Writing – original draft, Writing – review & editing
Joseph Ngugi Kamau: Formal Analysis, Supervision, Validation, Visualization, Writing – original draft, Writing – review & editing
Mohit Bajaj: Formal Analysis, Supervision, Validation, Visualization, Writing – original draft, Writing – review & editing
Data Accessibility
The corresponding author can provide the datasets created and/or analyzed during the current work upon reasonable request, but they are not publicly accessible.
Conflicts of Interest
The authors declare no conflicts of interest.
References
| [1] |
D. B. Aeggegn, A. Salau, and Y. Gebru, “Load flow and contingency analysis for transmission line outage,” Int. J. Electr. Eng., vol. 3, no. September, pp. 581-594, 2020.
|
| [2] |
M. A. Tikuneh and G. B. Worku, “Identification of system vulnerabilities in the Ethiopian electric power system,” Glob. Energy Interconnect., vol. 1, no. 3, pp. 358-365, 2018, Available:
https://doi.org/10.14171/j.2096-5117.gei.2018.03.007
|
| [3] |
S. A. AHMAD, “Contingency analysis and reliability evaluation of bangladesh power system,” no. April, 2011.
|
| [4] |
I. B. S, A. Nurdiansyah, A. Lomi, A. E. Power, and S. Stability, “Impact of Load Shedding on Frequency and Voltage System,” IEEE, pp. 110-115, 2017.
|
| [5] |
O. Mogaka, R. Orenge, and J. Ndirangu, “Static Voltage Stability Assessment of the Kenyan Power Network,” J. Electr. Comput. Eng., vol. 2021, 2021.
|
| [6] |
R. Kumar, A. Mittal, N. Sharma, I. V. Duggal, and A. Kumar, “PV and QV curve analysis using series and shunt compensation,” PIICON 2020 - 9th IEEE Power India Int. Conf., 2020.
|
| [7] |
P. C. Sahu, R. C. Prusty, and B. K. Sahoo, “Modified sine cosine algorithm-based fuzzy-aided PID controller for automatic generation control of multiarea power systems,” Soft Comput., vol. 24, no. 17, pp. 12919-12936, 2020, Available:
https://doi.org/10.1007/s00500-020-04716-y
|
| [8] |
N. Manjul and M. S. Rawat, “PV/QV Curve based Optimal Placement of Static Var System in Power Network using DigSilent Power Factory,” 8th IEEE Power India Int. Conf. PIICON 2018, no. July 2020, pp. 1-6, 2018.
|
| [9] |
C. Li, Y. Sun, and Y. Yu, “An Under-frequency Load Shedding Scheme with Continuous Load Control Proportional to Frequency Deviation,” IOP Conf. Ser. Mater. Sci. Eng., vol. 199, no. 1, pp. 0-6, 2017.
|
| [10] |
P. Pourghasem and H. Seyedi, “An under-voltage load shedding scheme to prevent voltage collapse in a microgrid,” Int. Conf. Prot. Autom. Power Syst. IPAPS 2019, no. February, pp. 12-16, 2019.
|
| [11] |
P. S. Engineering, “Contingency Analaysis of Ethiopian Power System on 230 kV and 400 kV Transmission Lines,” 2020.
|
| [12] |
C. Ibeni, “Analysis for Electical Load Flow Studies in Port Harcourt, Nigeria, Using Newton Raphson Fast Decoupled Techniques. American Journal of Engineering Research (AJER),” no. 12, pp. 230-240, 2017.
|
| [13] |
T. Gonen, “- Power Flow Analysis,” Mod. Power Syst. Anal., vol. 2, pp. 490-551, 2013.
|
| [14] |
A. N. J. B. P. Kundur, Power system stability and control, vol. 7. 1994.
|
| [15] |
N. S. Swaroop, “Contingency Analysis and Ranking on 400 Kv Karnataka Network By Using Mipower,” Ijsdr, vol. 1, no. 10, pp. 287-294, 2019.
|
| [16] |
M. S. Geremew, Y. G. Workie, and L. B. Techane, “Identification of System Exposure for the Northwest Region of Ethiopian Electric Power,” Iran. J. Sci. Technol. - Trans. Electr. Eng., vol. 0123456789, 2024, Available:
https://doi.org/10.1007/s40998-024-00698-x
|
| [17] |
S. Gupta, “A Review : Power System Stability Improvement using Power System Load Shedding Scheme,” vol. 3, no. 4, pp. 253-256, 2016.
|
| [18] |
P. Lakra and M. Kirar, “Load Shedding techniques For System With Cogeneration,” no. February, 2018.
|
| [19] |
H. Haes, M. Esmail, H. Golshan, T. Cuthbert, and N. D. Hatziargyriou, “An Overview of UFLS in Conventional, Modern, and Future Smart Power Systems : Challenges and Opportunities,” Electr. Power Syst. Res., vol. 179, no. February 2019, p. 106054, 2020,
https://doi.org/10.1016/j.epsr.2019.106054
|
| [20] |
M. Usman, A. Amin, M. M. Azam, and H. Mokhlis, “Optimal Under Voltage Load Scheme for a Distribution Network Using EPSO Algorithm,” no. September 2019, 2018.
|
| [21] |
R. M. Larik, M. W. Mustafa, S. Qazi, and N. H. Mirjat, “Under Voltage Load Shedding Scheme to Provide Voltage Stability,” Energy, Environ. Sustain. Dev. 2016 (EESD 2016), no. November, 2016.
|
| [22] |
P. Joshi, “Load Shedding Algorithm Using Voltage and Frequency Data,” TigerPrints Clemson Univ., 2007, Available:
https://tigerprints.clemson.edu/all_theses
|
Cite This Article
-
APA Style
Geremew, M. S., Workie, Y. G., Techane, L. B., Kamau, J. N., Bajaj, M. (2025). Voltage Stability Enhancement in North West Ethiopia’s Power Grid Using Contingency Analysis and PSO-Based Load Shedding. American Journal of Modern Energy, 11(3), 41-58. https://doi.org/10.11648/j.ajme.20251103.11
 Copy
|
Copy
|
 Download
ACS Style
Geremew, M. S.; Workie, Y. G.; Techane, L. B.; Kamau, J. N.; Bajaj, M. Voltage Stability Enhancement in North West Ethiopia’s Power Grid Using Contingency Analysis and PSO-Based Load Shedding. Am. J. Mod. Energy 2025, 11(3), 41-58. doi: 10.11648/j.ajme.20251103.11
Copy
|
Download
AMA Style
Geremew MS, Workie YG, Techane LB, Kamau JN, Bajaj M. Voltage Stability Enhancement in North West Ethiopia’s Power Grid Using Contingency Analysis and PSO-Based Load Shedding. Am J Mod Energy. 2025;11(3):41-58. doi: 10.11648/j.ajme.20251103.11
Copy
|
Download
-
@article{10.11648/j.ajme.20251103.11,
  author = {Mebratu Sintie Geremew and Yalew Gebru Workie and Lidia Bitew Techane and Joseph Ngugi Kamau and Mohit Bajaj},
  title = {Voltage Stability Enhancement in North West Ethiopia’s Power Grid Using Contingency Analysis and PSO-Based Load Shedding
},
  journal = {American Journal of Modern Energy},
  volume = {11},
  number = {3},
  pages = {41-58},
  doi = {10.11648/j.ajme.20251103.11},
  url = {https://doi.org/10.11648/j.ajme.20251103.11},
  eprint = {https://article.sciencepublishinggroup.com/pdf/10.11648.j.ajme.20251103.11},
  abstract = {This study presents an integrated methodology to enhance voltage stability and operational security in the North West Ethiopian power grid by addressing system vulnerabilities and optimizing load-shedding strategies. A hybrid simulation-optimization framework is developed, combining DIgSILENT PowerFactory-based contingency analysis with Particle Swarm Optimization (PSO)-driven intelligent load shedding in MATLAB. The modeled power network comprises 2 generators, 15 buses, 15 transmission lines, and 3 external grids. Vulnerability assessment is conducted using Voltage and Overload Performance Indices (PIV and PIP) to rank critical elements under various contingencies. The analysis identifies the BDII-230 to GOII transmission line as the most vulnerable, where its outage causes voltage drops to 0.908 p.u. at Gondar and 0.923 p.u. at Metema, both falling below acceptable operational limits. Under increased load conditions (50% and 75% load factor), the Gondar bus experiences severe voltage deterioration, dropping to 0.8879 p.u., which significantly stresses system stability. Through PSO-based load shedding, the voltage at Gondar is restored to 0.9538 p.u., demonstrating a 7.4% improvement, while excessive real power (e.g., at BDII230) is reduced from 1.3235 to 0.8958 p.u. under 50% load increase, effectively stabilizing the system. The proposed PSO framework outperforms conventional load-shedding mechanisms by factoring in bus sensitivity and minimizing overall power shed while maximizing voltage recovery. The results provide actionable insights for grid operators and planners, establishing a reliable and scalable method for real-time contingency response in developing power networks.
},
 year = {2025}
}
Copy
|
Download
-
TY  - JOUR
T1  - Voltage Stability Enhancement in North West Ethiopia’s Power Grid Using Contingency Analysis and PSO-Based Load Shedding

AU  - Mebratu Sintie Geremew
AU  - Yalew Gebru Workie
AU  - Lidia Bitew Techane
AU  - Joseph Ngugi Kamau
AU  - Mohit Bajaj
Y1  - 2025/10/09
PY  - 2025
N1  - https://doi.org/10.11648/j.ajme.20251103.11
DO  - 10.11648/j.ajme.20251103.11
T2  - American Journal of Modern Energy
JF  - American Journal of Modern Energy
JO  - American Journal of Modern Energy
SP  - 41
EP  - 58
PB  - Science Publishing Group
SN  - 2575-3797
UR  - https://doi.org/10.11648/j.ajme.20251103.11
AB  - This study presents an integrated methodology to enhance voltage stability and operational security in the North West Ethiopian power grid by addressing system vulnerabilities and optimizing load-shedding strategies. A hybrid simulation-optimization framework is developed, combining DIgSILENT PowerFactory-based contingency analysis with Particle Swarm Optimization (PSO)-driven intelligent load shedding in MATLAB. The modeled power network comprises 2 generators, 15 buses, 15 transmission lines, and 3 external grids. Vulnerability assessment is conducted using Voltage and Overload Performance Indices (PIV and PIP) to rank critical elements under various contingencies. The analysis identifies the BDII-230 to GOII transmission line as the most vulnerable, where its outage causes voltage drops to 0.908 p.u. at Gondar and 0.923 p.u. at Metema, both falling below acceptable operational limits. Under increased load conditions (50% and 75% load factor), the Gondar bus experiences severe voltage deterioration, dropping to 0.8879 p.u., which significantly stresses system stability. Through PSO-based load shedding, the voltage at Gondar is restored to 0.9538 p.u., demonstrating a 7.4% improvement, while excessive real power (e.g., at BDII230) is reduced from 1.3235 to 0.8958 p.u. under 50% load increase, effectively stabilizing the system. The proposed PSO framework outperforms conventional load-shedding mechanisms by factoring in bus sensitivity and minimizing overall power shed while maximizing voltage recovery. The results provide actionable insights for grid operators and planners, establishing a reliable and scalable method for real-time contingency response in developing power networks.

VL  - 11
IS  - 3
ER  -
Copy
|
Download